Subscribe now for full access and no adverts
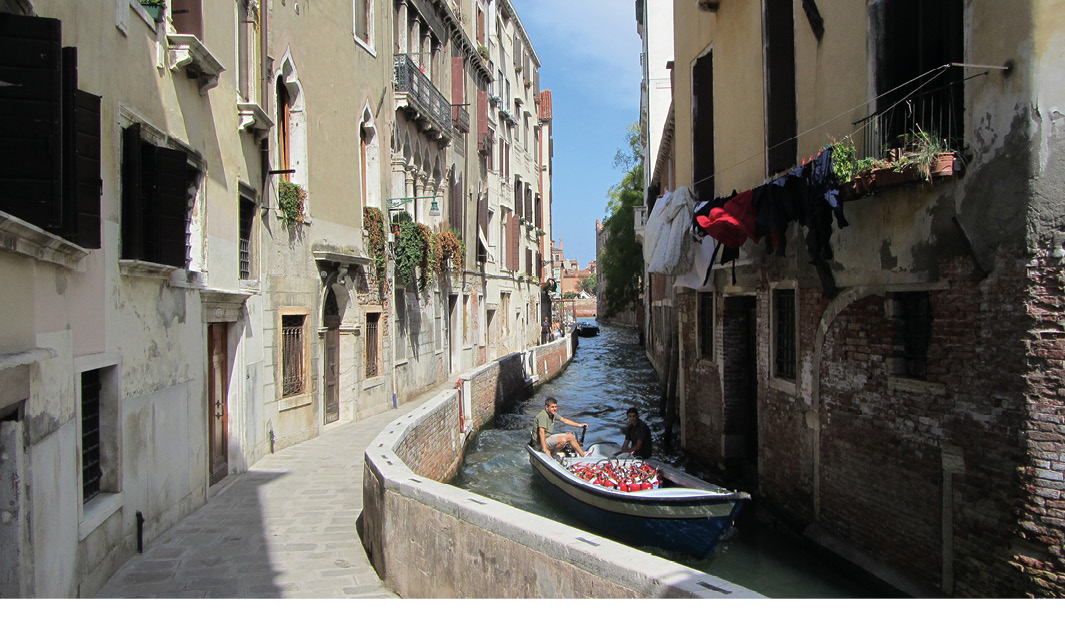
When Venice features in the media, the story is usually about the malign consequences of flooding, cruise ships, and tourism, which crowds out more positive news, like the development of the Venice Time Machine, due to be showcased at this year’s European Association of Archaeologists conference in Rome. This is the first product of a hugely ambitious European Commission project that aims to bring together every bit of digital data that currently exists to help us understand the entire history of Europe, no less. The scheme is dressed up in lots of flowery language, with charts purporting to show how it will all work (see http://www.timemachine.eu/about-us/ if you really want to know), but the developers of the Time Machine have wisely chosen to begin with the small and well-defined fragment of the European continent that is the Venetian archipelago. We will see whether this is ever scaled up to cover the entirety of Europe.
Time Machine Venice is just one of many such projects that are trying to harness the power of AI and supercomputers to bring together large and disparate datasets to tell a more holistic story about the historic environment – in simple terms, showing how the world has evolved and changed over time. Another such development is the Archaeological Atlas of France, published by Inrap, the National Institute for Preventive Archaeological Research, in November 2023. The Atlas consists of 100 maps synthesising thousands of finds, surveys, and excavations, starting with the migration of Homo sapiens into what is now France. It then traces their first artistic works, and ends with the marks left by the violence of the two World Wars and the post-War history of colonial and overseas France.
Each map represents a slice of time through France’s past, and is accompanied by analytical commentary, photographs, and artistic reconstructions of landscapes representing thousands of years of human occupation and activity. Or, as Inrap President Dominique Garcia put it, ‘the invisible heritage beneath our feet’. One map, for example, shows the distribution of ports, settlements, and finds (including tin, amber, wine amphorae, and ornaments) that constitute the evidence for 7th-century BC trade networks.

Map regression
Essentially these are large-scale distribution maps, and they use a rather old-fashioned medium (the printed page). Even so, it would be good to have similar maps for the UK and Ireland, showing the results of 35 years of developer-funded archaeology and the PAS records of metal-detectorist finds. Much could also be learned from bringing together historic maps, as pioneered by the Welsh Royal Commission’s award-winning Deep Mapping project, which uses software to find the best fit between historic maps (dating back to the 16th century) and the OS master map. Overlaying these maps and using software to highlight different features in the landscape enables us to see change and continuity in the landscape over time.
The next step beyond map regression is then to add in all the other data from Historic Environment Records, LiDAR, aerial photography, and the like – the potential is limitless, and would provide planners as well as archaeologists with a comprehensive visual account of historic landscape features that is hard to gather at present. Such information is vital for planning the location of new woodland as a carbon-offset measure, locating wind farms and solar arrays, or identifying land suitable for housing development and related infrastructure while at the same time preserving and enhancing what is significant in the historic environment – ancient woodland, peat bogs, and unploughed grassland, for example.
Going underground
A further dimension (literally) is to map what lies deep underground – including historic mining activity. Sherds learned recently, from Tim Tatton-Brown, that Oxford Archaeology has been mapping the vast network of Bath Stone underground quarries and tunnels around Corsham and Monkton Farleigh, in Wiltshire. Some of these were used as bombproof ammunition depots during the Second World War, before being turned into the Central Government War Headquarters (CGWHQ), the very existence of which was known only to a few hundred people until the 1970s. This 35-acre complex was built 120 feet underground in 1956-1961 to house the Prime Minister, Cabinet, and 4,000 civil servants and military personnel in the event of nuclear war. Above ground, the nearby Ministry of Defence Information Systems and Services (ISS) complex, the very secret hub of military communications, is said to be the most expensive building ever put up in Wiltshire. The bill for the ISS complex came in at £690m in 2008, compared with an estimated cost of £500m at today’s prices for constructing Salisbury Cathedral.